
Analytics overview
Survanta brings tenant-level monitoring and authored-content analysis into one area of the tenant dashboard. The analytics area is read-only: it helps an organization understand response activity and investigate specific survey content without changing responses or survey definitions.
The three analytics surfaces
| Surface | Use it to answer |
|---|---|
| Analytics dashboard | How many surveys and responses does the organization have, and when were responses recorded? |
| Entity Explorer | What happened at one question, group, main section, or dynamic table identified by its Code? |
| Two-code Comparison | How do the common measures for two coded entities differ? |
Start with the dashboard for context. Move to the Explorer when you know the authored item you want to inspect, then use Comparison when the two sides have a meaningful relationship.
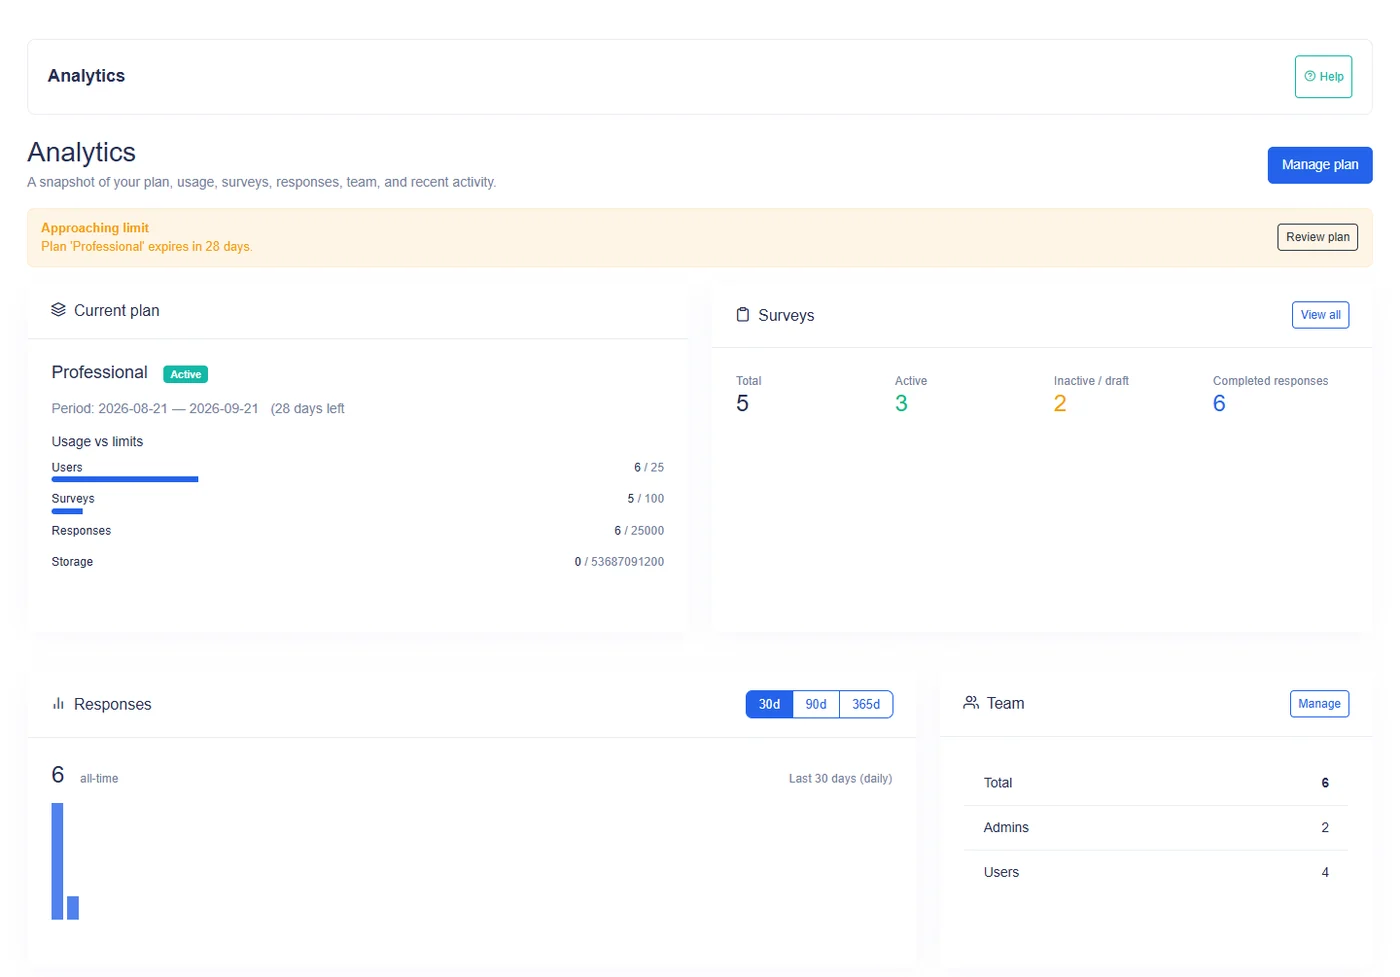
What the dashboard counts
The survey summary separates several numbers that should not be read as if they were the same measure.
| Number | Meaning |
|---|---|
| Total surveys | All surveys belonging to the organization |
| Active surveys | Surveys currently marked active |
| Inactive surveys | Surveys currently marked inactive |
| Completed responses | Response records currently in completed status across the organization |
| All-time responses | All response records across the organization, regardless of the selected activity window |
Completed responses is a count, not a completion percentage. The dashboard does not divide it by the all-time response total or infer why another response has a different status.
The all-time response total remains unchanged when you switch the time window. The window affects only the response-activity bars underneath it.
Response activity over time
The response card groups response records by when they were created. Each vertical bar represents one time bucket, and its height is relative to the largest bucket currently shown.
| Window | Bucket size | Useful for |
|---|---|---|
| Last 30 days | One day | Recent fieldwork and short collection periods |
| Last 90 days | One week | Multi-week studies and medium-term changes |
| Last 365 days | One month | Seasonal or annual activity patterns |
The bars are a volume view. They show when response records were created, not when every individual answer was entered and not how long a respondent spent in a section.
If the selected window contains no response records, the card shows an empty state rather than a fabricated series.
How to read the activity bars
- Confirm the selected window before interpreting the pattern.
- Read the all-time total separately from the bars.
- Compare neighboring buckets to identify changes in collection volume.
- Treat a short bar as lower volume relative to the highest bucket on this screen.
- Investigate operational context before assigning a cause to a rise or fall.
Because the bars are scaled to the largest bucket, their visual height is comparative. Hover information identifies the bucket date and its response count.
Survey and team distributions
The dashboard also separates:
- active surveys from inactive surveys;
- active organization users who are tenant administrators from other active organization users;
- current plan usage for users, surveys, responses, and storage;
- recent notifications, recent activity, invoices, and usage warnings where data is available.
These supporting cards provide operational context. They do not replace the authored-content analysis in the Entity Explorer.
Moving from totals to authored content
The dashboard tells you that activity exists. It does not show which specific question, group, section, or dynamic table produced a pattern.
Use the Analytics Entity Explorer to select an entity type and resolve an authored Code. The resulting report applies measures that fit that entity type, such as question coverage, group completion, section drop-off, or dynamic-table row and column fill.
Use Comparing two codes when you need a side-by-side view. Comparison is most informative when the two codes represent the same kind of content or when the shared percentage-based measures have a clear business meaning.
What analytics can tell you
The analytics area can help you identify:
- collection volume over the selected time window;
- the number of active and inactive surveys;
- the number of response records currently completed;
- whether a coded entity appears in many or few survey responses;
- where question, group, section, or table fill is lower;
- how answer values are distributed for supported question and table-column types;
- how common measures differ between two resolved codes.
What analytics does not tell you
The analytics area does not by itself establish:
- why respondents chose an answer;
- whether a difference is statistically significant;
- whether a low value is caused by survey logic, field practice, or respondent behavior;
- the amount of time spent inside a main section;
- per-question eligibility created by conditions.
For question coverage, the denominator is all stored responses for the owning survey because separate condition-based eligibility is not stored for each question. A question shown only to some respondents may therefore have a lower coverage rate by design.
A practical review sequence
For a collection period with an unexpected decline:
- Select the dashboard window that matches the fieldwork period.
- Check whether the decline appears in one bucket or across several buckets.
- Confirm whether active survey counts changed during the same period.
- Open the Entity Explorer for the relevant section or group Code.
- Review per-question fill and drop-off without assuming that conditions made every question eligible.
- Compare two related codes only when their common measures describe comparable work.
- Return to response review when row-level investigation or correction is required.
Notes for responsible interpretation
Percentages should always be read with their denominator. A high fill rate based on a small number of responses is different from the same rate across a large study.
Repeated groups use recorded occurrences when calculating their fill and completion measures. Main sections also account for separate question slots created by recorded group occurrences.
Dynamic-table fill is based on filled cells across recorded rows and analyzed columns. It should not be read as the same thing as a question answer count.