
Analytics Entity Explorer
The Analytics Entity Explorer turns an authored Code into a focused report. It is intended for Survey Managers, Research Managers, M&E teams, and analysts who need to examine one part of a survey without working with internal numeric identifiers.
What a Code means
A Code is the short identifier an author gives to a question, question group, main section, or dynamic table. A clear Code lets a team refer to the same authored item in survey design, analysis, exports, and integrations.
Codes are useful because names and displayed text may be long or may change for respondents. A Code can remain a concise reference when the team keeps it unchanged. It is not a substitute for governance: authors should still agree on naming conventions and avoid reusing a Code where uniqueness matters.
Supported entity types
The Explorer supports exactly four entity types.
| Entity type | What it represents |
|---|---|
| Question | One authored question outside a dynamic-table column definition |
| Question group | A group of active questions within a section |
| Main section | A main survey section, including its direct and grouped questions |
| Dynamic table | One authored dynamic response table and its active columns |
Static content blocks and whole surveys are not Explorer entity types.
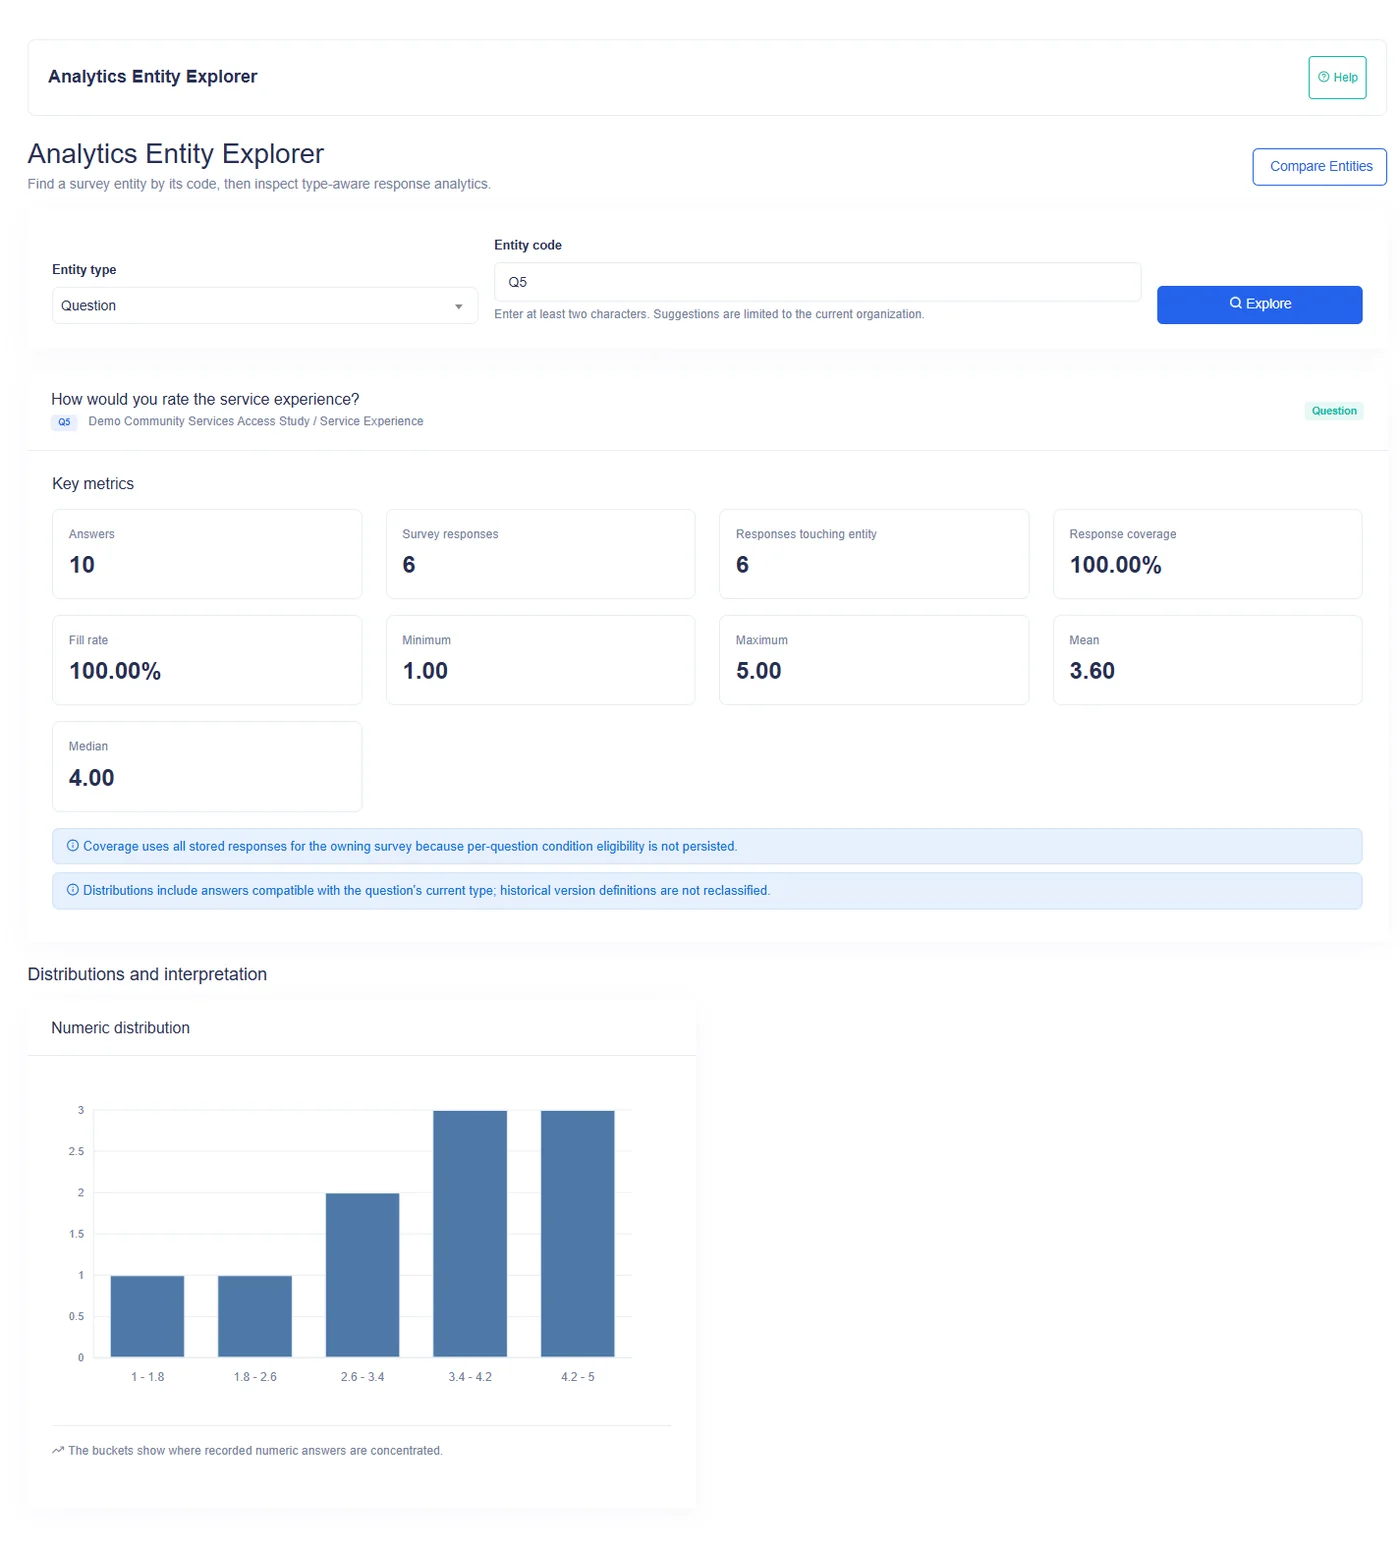
Find an entity
- Open the Entity Explorer from the tenant analytics area.
- Choose the entity type first.
- Enter at least two characters from the Code or displayed name to see suggestions.
- Review the survey and section context shown with each suggestion.
- Select or enter the Code.
- Run the exploration.
Suggestions are limited to content belonging to the current organization and to the selected entity type. They search both the Code and the displayed name. The suggestion list is bounded and may contain current or retained historical authored content that has not been deleted.
Changing the entity type clears the current Code selection so that a question Code is not silently resolved as another kind of entity.
Exact Code resolution
Suggestions help you find a value, but the report resolves the submitted Code as an exact Code within the selected type and organization.
Possible outcomes are:
| Outcome | What you see |
|---|---|
| No Code | The Explorer remains ready for input |
| No match | A message that no entity was found |
| One match | The type-aware report |
| More than one match | A candidate list requiring an explicit selection |
When a Code is ambiguous
Two authored entities of the same selected type can share a Code, for example when separate surveys reused the same naming convention. Survanta does not choose one silently.
Instead, the Explorer lists candidates with:
- entity type;
- displayed name;
- survey name;
- section and group path where applicable;
- Code.
Select the intended candidate. The report is generated only after that explicit choice.
Ambiguity is handled within the selected entity type. Choosing Question and choosing Main section are separate searches, even if the entered Code text is the same.
Metrics shared across reports
Several labels recur, but their denominator depends on the entity.
| Metric | General meaning |
|---|---|
| Responses touching entity | Distinct responses with a meaningful answer, or with a recorded row for a dynamic table |
| Response coverage | Responses touching the entity as a percentage of stored responses for its survey |
| Fill rate | Filled answer slots divided by the slots expected for that entity |
For a single question, fill rate and response coverage are the same percentage. For groups, sections, and tables, fill rate considers multiple question or cell slots and is therefore a different calculation.
Question report
Every resolved question report produces these metrics:
- answers;
- survey responses;
- responses touching the question;
- response coverage;
- fill rate.
Choice questions also produce a selections count. Integer, Decimal, and Rating questions add minimum, maximum, mean, and median when numeric values exist.
| Question type | Additional visual |
|---|---|
| Text | Most frequent non-empty text values, shortened for display |
| Integer, Decimal, Rating | Numeric distribution in five ranges, or one value when all values are equal |
| Yes/No, Single Choice, Multiple Choice | Choice distribution; the report also counts selections |
| Date | Answer counts by date |
| Duration | Frequency of recorded duration values |
| File | Distribution by detected file type |
| Lookup, Cascading Lookup, Multi Lookup | Distribution of selected lookup labels or codes |
Question coverage uses all stored responses for the owning survey. Per-question eligibility created by conditions is not stored separately, so a conditionally shown question can have lower coverage by design.
Distributions include answers compatible with the question's current type. Historical definitions are not reclassified into the current type.
Question-group report
A question-group report produces:
- active question count;
- responses touching the group;
- response coverage;
- fill rate;
- completion rate.
The report shows a bar chart of fill by question. If recorded group occurrences exist, it also shows how many occurrences were recorded per response.
For a repeated group, fill and completion are calculated per recorded occurrence. An occurrence is complete when all active questions in that occurrence have meaningful answers. For a non-repeated group, completion is evaluated per survey response.
Main-section report
A main-section report produces:
- active question count;
- responses touching the section;
- response coverage;
- fill rate;
- completion rate.
For a section, fill rate and completion rate use the same filled-slot percentage. The expected slots include ordinary question slots for each stored survey response and separate slots for every recorded occurrence of a repeated group.
The section report shows:
- fill rate for each question as a bar chart;
- unanswered response counts across questions as a line chart.
Section-level time is not stored, so the Explorer does not infer a section duration from whole-response timing.
Dynamic-table report
A dynamic-table report produces:
- recorded rows;
- columns analyzed;
- responses touching the table;
- response coverage;
- fill rate across recorded rows and analyzed columns.
It shows rows per response and fill by column. It can also show a type-aware distribution for each of the first 12 analyzed columns: numeric summary, date distribution, choice distribution, lookup distribution, file-type distribution, or frequent text and duration values.
The report considers the first 50 active columns. When a table has more, an information note explains the report boundary.
Chart rendering
Entity reports use ApexCharts. The report data currently requests two chart kinds:
- bar charts for distributions, fill rates, occurrence counts, and numeric summaries;
- line charts for date distributions and section question drop-off.
If a chart has no labels or values, the report displays a no-data state instead of drawing an empty chart.
Worked interpretation
Suppose a main-section Code resolves to a report with high response coverage but lower fill and completion. That combination means many responses reached at least one question in the section, while fewer expected question slots were filled.
Next steps could be:
- Read the per-question fill bars.
- Check the drop-off line for questions with more unanswered responses.
- Review whether conditions intentionally hide those questions.
- Inspect any repeated group separately because its completion is occurrence-based.
- Review individual responses before deciding that collection practice must change.