
Comparing two codes
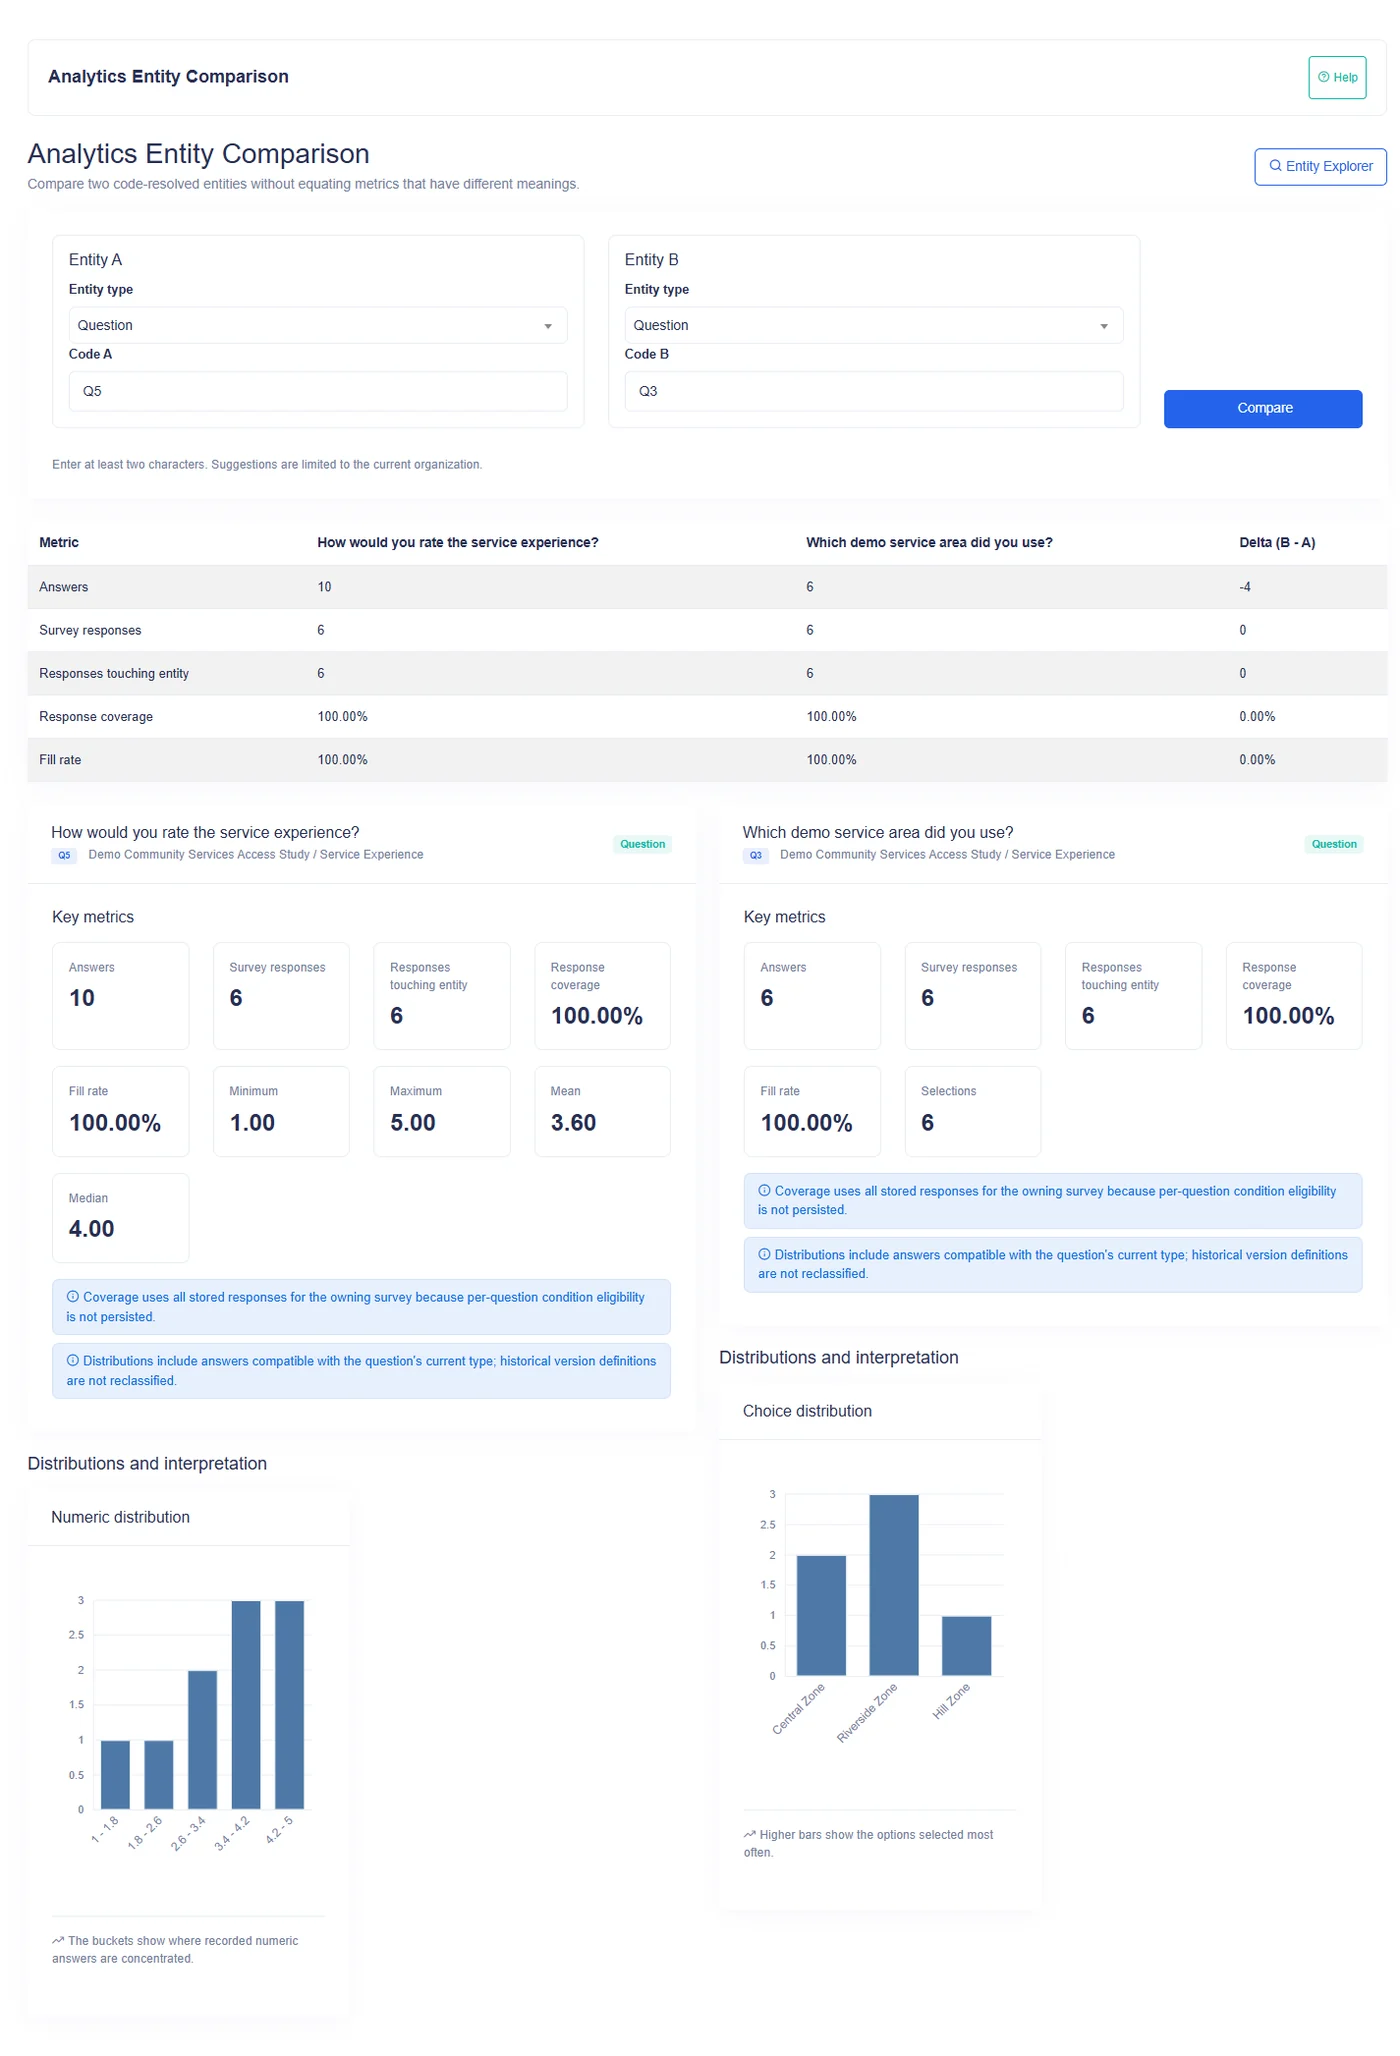
The two-code Comparison places two resolved authored entities side by side. It helps analysts compare common measures while preserving the context and type-specific report for each side.
Comparison is not a request to force every number into one table. Survanta compares a metric only when both resolved reports produce that metric and the pairing is meaningful under the comparison rules.
What you choose
Each side has its own:
- entity type;
- Code;
- suggestion list;
- candidate selection when the Code is ambiguous.
The supported entity types are Question, Question group, Main section, and Dynamic table.
Choose Code A and Code B based on the analytical question, not simply because their labels look similar.
Resolve both sides first
Suggestions appear after at least two characters and are constrained to the selected type and current organization. A submitted Code is then resolved as an exact Code.
If either side has no match, the comparison cannot calculate common metrics. If a Code matches more than one entity of the selected type, that side presents its candidate list and waits for an explicit selection.
The candidate context includes the displayed name, survey, section, and group where applicable. Resolve both sides before interpreting any difference.
Same-type comparison
When A and B use the same entity type, the comparison includes every metric key produced by both reports. The metric must exist on both sides.
Examples include:
| Same-type pair | Common metrics that can appear |
|---|---|
| Question and Question | Answers, survey responses, responses touching the question, coverage, fill rate |
| Two choice questions | The question metrics plus selections |
| Two numeric questions with values | The question metrics plus minimum, maximum, mean, and median |
| Question group and Question group | Questions, responses touching the group, coverage, fill, completion |
| Main section and Main section | Questions, responses touching the section, coverage, fill, completion |
| Dynamic table and Dynamic table | Recorded rows, columns analyzed, responses touching the table, coverage, fill |
If a conditional metric is absent on one side, it is not placed in the common table. For example, numeric summary metrics require numeric values in both question reports.
How differences are shown
The common-metrics table shows:
| Column | Meaning |
|---|---|
| Metric | The shared measure |
| Code A value | Value from the first resolved report |
| Code B value | Value from the second resolved report |
| Difference | Code B minus Code A |
A positive difference means B is higher than A. A negative difference means B is lower than A. For a percentage metric, the displayed difference is the subtraction of the two displayed percentage values.
Direction is not quality. A positive difference in recorded rows may reflect a larger roster, while a negative difference in unanswered responses may be desirable. Interpret the measure in its survey context.
Different-type comparison
When A and B are different entity types, Survanta restricts the common table to metrics marked suitable for normalization and present on both sides.
The shared normalized metrics can include:
- responses touching the entity;
- response coverage;
- fill rate;
- completion rate when comparing a question group with a main section.
These metrics still need context. A question fill rate is the share of survey responses with a meaningful answer to that question. A table fill rate is the share of expected cells filled across recorded rows and analyzed columns. The common percentage format makes a side-by-side view possible, but it does not make the underlying work identical.
Why some metrics are omitted
Counts and summaries tied to different units can create a false comparison. Survanta therefore omits them from a cross-type common table.
Examples include:
- question answer and selection counts versus table row counts;
- question count versus column count;
- numeric minimum, maximum, mean, and median versus a section completion measure;
- a choice distribution versus a table row-count distribution;
- a section drop-off line versus a question date distribution.
The page names omitted measures and chart titles rather than inserting unrelated values into the same row. Each side's full type-aware report remains visible below the common table, including its own charts.
Chart behavior
The comparison itself is a metric table; it does not create a combined comparison chart. The two entity reports are displayed side by side.
Those reports use ApexCharts and currently render:
- bar charts for distributions, fill rates, occurrence counts, and numeric summaries;
- line charts for date distributions and main-section drop-off.
Keeping charts separate preserves their labels, units, and interpretation notes.
Practical example: two rating questions
Suppose an organization uses one Rating question after an initial service interaction and another Rating question after follow-up. Both have stable Codes and both contain numeric answers.
The same-type comparison can show:
- how many answers each question received;
- how many stored survey responses touched each question;
- coverage and fill rates;
- minimum, maximum, mean, and median;
- the signed B-minus-A difference for each common metric.
The separate numeric-distribution charts show the shape of each answer set. A higher mean on B is descriptive; the page does not calculate statistical significance or explain the cause.
Practical example: group and section
A Research Manager may compare a repeated household-details group with its owning main section. This is a cross-type pair.
The table can compare shared normalized measures such as responses touching the entity, coverage, fill, and completion. It will omit the group's question count and its occurrence distribution from the common table, and it will omit the section's drop-off chart from that table. Both remain available in the separate reports.
Choosing a useful pair
Before comparing, ask:
- Do both Codes refer to the intended survey content?
- Are both candidate selections unambiguous?
- Do the common metrics have compatible operational meaning?
- Are conditions or repetition changing the denominator?
- Is the response volume large enough for the difference to be useful?
- Do you need row-level response review before drawing a conclusion?
Interpretation cautions
Question coverage uses all stored responses for the owning survey because condition-based question eligibility is not stored separately.
Repeated-group completion is calculated per recorded occurrence. Main-section completion includes separate question slots for recorded group occurrences. Dynamic-table fill uses filled cells across rows and analyzed columns.
These denominator differences are why the page omits incompatible metrics instead of presenting a number that looks comparable but measures something else.